Uploads by HansR
From Cumulus Wiki
Jump to navigationJump to search
This special page shows all uploaded files.
| Date | Name | Thumbnail | Size | Description | Versions |
|---|---|---|---|---|---|
| 05:54, 26 March 2021 | CompassRose-1.png (file) |  |
2 KB | One of three distributed compass roses used in CumulusUtils StationMap | 1 |
| 05:54, 26 March 2021 | CompassRose-2.png (file) | 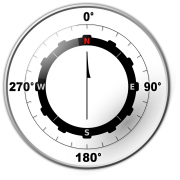 |
246 KB | Number two of three distributed compass roses used in CumulusUtils StationMap | 1 |
| 06:14, 26 March 2021 | CompassRose-3.png (file) |  |
6 KB | Number three of three distributed compass roses used in CumulusUtils | 1 |
| 06:15, 26 March 2021 | WindArrow-1.png (file) |  |
72 KB | Distributed windarrow used in CumulusUtils | 1 |
| 06:59, 26 March 2021 | PwsFWI legend.jpg (file) | 19 KB | The legend of pwsFWI | 1 | |
| 07:06, 26 March 2021 | Phils backyard12.JPG (file) | 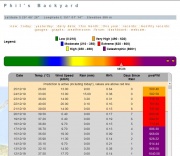 |
98 KB | pwsFWI on Phil's backyard | 1 |
| 19:07, 1 April 2021 | Charts Daily Rain.jpg (file) | 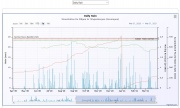 |
130 KB | 1 | |
| 19:35, 1 April 2021 | Charts Monthly Rain.jpg (file) | 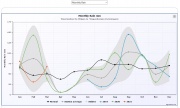 |
104 KB | 1 | |
| 09:08, 2 April 2021 | Year Rain Statistics.jpg (file) | 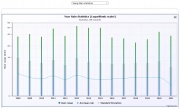 |
104 KB | 1 | |
| 09:18, 2 April 2021 | Year Month Rain Statistics.jpg (file) | 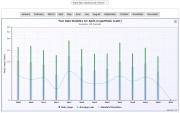 |
115 KB | 1 | |
| 11:03, 2 April 2021 | Monthly Temperatures.jpg (file) | 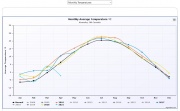 |
112 KB | 1 | |
| 11:32, 2 April 2021 | Year Temperature Statistics.jpg (file) | 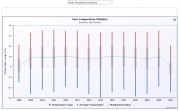 |
108 KB | 1 | |
| 11:34, 2 April 2021 | Year Temperature Statistics per Month.jpg (file) | 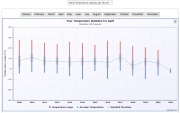 |
109 KB | 1 | |
| 11:49, 2 April 2021 | Warmer Days.jpg (file) | 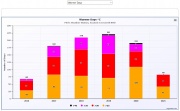 |
96 KB | 1 | |
| 11:51, 2 April 2021 | Heatmap.jpg (file) | 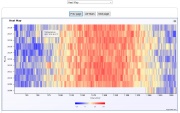 |
137 KB | 1 | |
| 12:35, 8 April 2021 | WindRose.jpg (file) | 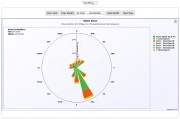 |
89 KB | 1 | |
| 12:43, 8 April 2021 | WindRun.jpg (file) | 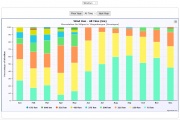 |
115 KB | 1 | |
| 08:17, 9 April 2021 | Solar Hours Statistics.jpg (file) | 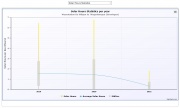 |
82 KB | 1 | |
| 08:19, 9 April 2021 | Monthly solar hours statistics per year.jpg (file) | 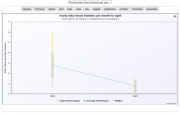 |
94 KB | 1 | |
| 08:20, 9 April 2021 | Insolation statistics.jpg (file) | 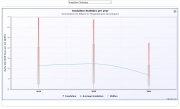 |
80 KB | 1 | |
| 08:22, 9 April 2021 | Monthly insolation statistics per year.jpg (file) | 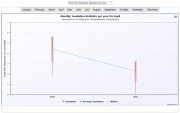 |
94 KB | 1 | |
| 16:08, 10 April 2021 | TemperatureSum.jpg (file) | 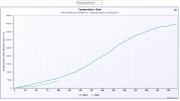 |
89 KB | 1 | |
| 16:09, 10 April 2021 | Growing Degree Days.jpg (file) | 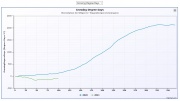 |
79 KB | 1 | |
| 16:10, 10 April 2021 | Daily EVT.jpg (file) |  |
129 KB | 1 | |
| 16:12, 10 April 2021 | Monthly EVT.jpg (file) | 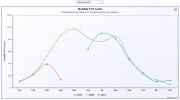 |
83 KB | 1 | |
| 16:14, 10 April 2021 | Clash of Averages.jpg (file) | 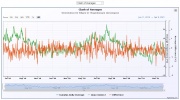 |
141 KB | 1 | |
| 08:29, 16 April 2021 | Airquality Tableview.jpg (file) |  |
84 KB | 1 | |
| 08:30, 16 April 2021 | Airquality Graphview.jpg (file) | 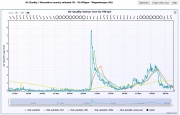 |
150 KB | 1 | |
| 12:46, 16 April 2021 | Website example.jpg (file) |  |
332 KB | 1 | |
| 10:59, 17 April 2021 | CDL for Wiki.pdf (file) | 35 KB | 1 | ||
| 17:30, 26 April 2021 | Thermal Seasons.jpg (file) | 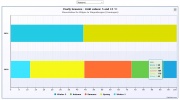 |
78 KB | 1 | |
| 08:28, 15 May 2021 | Avergare Temeprature with range.jpg (file) | 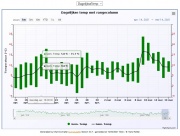 |
105 KB | 1 | |
| 13:51, 21 May 2021 | Schermafbeelding 2021-05-21 154949.jpg (file) | 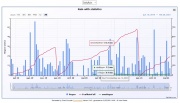 |
130 KB | 1 | |
| 12:14, 20 July 2021 | Dashboard part 1.jpg (file) | 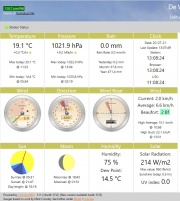 |
159 KB | 1 | |
| 12:15, 20 July 2021 | Dashboard part 2.jpg (file) | 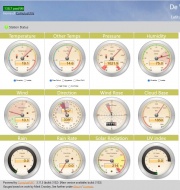 |
153 KB | 1 | |
| 13:14, 24 September 2022 | Extra Webfiles config.jpg (file) | 28 KB | 1 | ||
| 07:34, 14 December 2023 | RainVsEVT.png (file) | 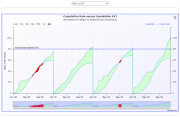 |
149 KB | Rain versus Evapotranspiration, four years charted. | 1 |
| 07:34, 14 January 2025 | Frost days.png (file) |  |
105 KB | 1 | |
| 11:39, 27 August 2025 | ChartCompilerSpec.jpeg (file) |  |
261 KB | 12 | |
| 12:48, 28 January 2026 | CumulusUtils Logo.png (file) | 44 KB | 1 |