AirLink: Difference between revisions
(Initial edit) |
(No difference)
|
Revision as of 08:57, 16 April 2021
Introduction
In 2020 support for the Davis Airlink device was introduced in CumulusMX. Although AirQuality sensors had been supported by CumulusMX as Extra Sensors - which are not supported by CumulusUtils - this Davis device had specific tables and support incorporated and as such could be supported by CumulusUtils. The Davis Airlink is supported by a Table view and by graphing the measured values. Future AirQuality devices will need a consistent use of an underlying data structure and interface to be supported.
Operation
The operation requires two steps:
- creating the AirQuality page to be used by the user (or in the generated website)
- creating the datafile to be used by the AirQuality page. Although CumulusMX is able to produce an AirQuality.JSON datafile, that file is not used because it uses only the direct measured data. CumulusUtils produces its own datafile to be able to display all possible averages produced by the AirLink (and which are stored but not used by CumulusMX). These values are: raw data, one hour running average, three hour running average, 24 hour running average and the nowcast average.
The commands for the above named steps are:
utils/bin/cumulusutils.exe AirQuality => this command includes the following step to create the first datafile
and:
utils/bin/cumulusutils.exe UserAskedData => this command produces the AirQuality datafiles with only those data required for the user wanted display.
Output
The output is the file: airquality.txt and contains the TableView and the GraphView of the data. Beside that the file airlinkrealtime.txt is used to be processed by CumulusMX for support of realtime behaviour (see Inner working).
The output for the datafiles is: airlinkdataOut2p5.json and airlinkdataOut10.json
Inifile Parameters
The AirQuality module has the following inifile parameters (see cumulusutils.ini):
 [AirQuality]
 CountrySelected=EU            => Determines the country for which the AQI must be calculated. This value must be identical to what is entered in CMX
 WantToSeeNow=true             => If true will show the raw data
 WantToSeeNowCast=true         => If true will show the nowcast average
 WantToSee1hr=true             => If true will show the one hour running average
 WantToSee3hr=true             => If true will show the three hour running average
 WantToSee24hr=true            => If true will show the 24 hour running average
 WantToSeeWind=true            => If true will show the windbarbs in the chart indicating the wind direction
Inner working
If at least one sensor has been activated within CumulusMX, CumulusUtils will create the Airlink output. If no sensor has been activated nothing will be generated.
For each sensor (In and Out) similar code is produced with similar coding of variable names.
Then, for facilitating realtime behaviour, the file airlinkrealtime.txt is generated which the user has to enter in the Extra Webfiles section in the settings of CumulusMX. The target directory must be the webroot (where the AirQuality page is activated). Tick: Process, Realtime and FTP.
Then the menu is generated, creating two buttons to enable the user to switch between Table view and Graph view. In case of the Website Generator there is also a help button displaying information about the AirQuality. This help button is not available when running as a module.
TableView
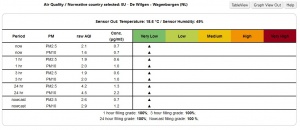
After these initial generations the table itself is generated where for each type of value the user wishes to see (Now, 1 hour average, 3 hour average, 24 hour average and NowCast) a specific code section is generated. For e.g. NowCast this looks like:
 var nowcastPM2p5_OutVal = AirLinkRT[7+0];
 var nowcastPM10_OutVal = AirLinkRT[12+0];
 var nowcastPM2p5_OutAQI = AirLinkRT[17+0];
 var nowcastPM2p5_OutAQIint = NormaliseAQI(nowcastPM2p5_OutAQI);
 var nowcastPM10_OutAQI = AirLinkRT[22+0];
 var nowcastPM10_OutAQIint = NormaliseAQI(nowcastPM10_OutAQI);
 $('#nowcastPM2p5_OutVal').html(nowcastPM2p5_OutVal);
 $('#nowcastPM2p5_OutAQI').html(nowcastPM2p5_OutAQI);
 $('#nowcastPM10_OutVal').html(nowcastPM10_OutVal);
 $('#nowcastPM10_OutAQI').html(nowcastPM10_OutAQI);
 for (i = 0; i < 5; i++) { (i+1 == nowcastPM2p5_OutAQIint ? $('#nowcastPM2p5ArrowOut'+i).html('▲') : $('#nowcastPM2p5ArrowOut'+i).html(' ') );  }
 for (i = 0; i < 5; i++) { (i+1 == nowcastPM10_OutAQIint ? $('#nowcastPM10ArrowOut'+i).html('▲') : $('#nowcastPM10ArrowOut'+i).html(' ') );  }
Where the coding of the fields and variables is rigid and should not be played with. There have been inventive modification spotted in the wild (e.g. disabling the graph) which though highly appreciated of course will get no support. Modifying generated code leaves you on your own.
GraphView
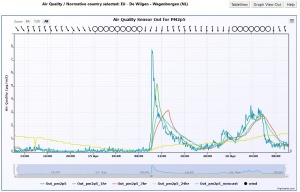
Together with the table view the Graph view is generated. The graphview does not display the realtime values but displays according to the Recent graph settings of CumulusMX i.e. according to the setting of the GraphHours parameter in the section Graphs in Cumulus.ini.
The line colouring obeys the default colouring of the current theme. No colouring is applied or defined with the graph itself.
The Air Quality Index (AQI)
The AQI is different per country. It is the warning level translation from the actual concentrations of Particulate matter measured. The AQI differs per country but differs not only in value but also in the series of value used. I created thread on the forum (first two messages) with information. For the calculations the values produced by CMX are used. The spreadsheet shows the values used in countries and their relation with the actual PM concentration. See also the Help button.
The Help Button
Because the Help button is not available in the the modular use of the AirQuality module its content is given here.
In Air Quality (with either the cheap sensors or the government published data) it is important to know about the Air Quality Indices (AQI) and PM concentrations. Those are very different things. The AQI differ very much per country, per period (1 hr, 3 hr or 24 hr averages) and in scales (6 divisions or 10 divisions with subdivisions). To make it even more complex, some countries did combine the fine dust (PM) AQIs with indices for SO2 and NO2. That is ignored here. These graphs only deal with Particulate Matter sensors. Please be aware that the scaling of the graphs is dynamic.
I made a post on the forum in which I added some links to the sites for specific countries. You will have to study yourself (if you want).
Please be aware that these charts only give the absolute measurements of the PM concentrations as given by the sensors used. The AQI levels for the different countries have great variations and I will not go through the trouble to display those levels in the graphs for the normative country selected.
The graphs show the indicative AQI levels of the EU-CAQI standards for the 1 hr series. These will show you reasonable short term danger levels although maybe not standardized in your country. 24 hr levels are considered irrelevant in the context of a personal station: you will be dead before this level reaches a level where help services are activated. If the 1 hr level shows an unhealthy level you better start running away (precautionary principle).
Yes, big differences in different countries. Therefore: study the documents and the danger levels in the matrix I supplied.

