CDL - STATS: Difference between revisions
(Created page with "== Introduction == The STATS plots a statistic of a specific Plotvariable in the chart. The normal PLOT of that variable must be present. STATS implies the ALL or DAILY range...") |
(No difference)
|
Revision as of 15:33, 22 May 2021
Introduction
The STATS plots a statistic of a specific Plotvariable in the chart. The normal PLOT of that variable must be present. STATS implies the ALL or DAILY range specification. RECENT PLOTS have no STATS defined (at the moment).
A STATistic is by definition a derivative of a series of a Plotvariable e.g. the Standard deviation or a running average. A Mean in itself is a single value and single value statistics are not plottable as such. They are usually reported in other ways. To be able to use the STATS for a certain Plotvariable the statistic needs to be made available in the runtime of the compiler. Technically it might be possible to supply statistics through the EVAL functionality and in some cases that might work. In general that technique is disadvised.
Statistical functions
The STATS keyword requires a Plotvariable on which to apply the statistics and a method to apply and a statistical method to use.
STATS <Plotvariable> <Statistical method>
The following statistical methods are available in the ChartsCompiler:
- SMA - Best explained in the external Wiki: Simple Moving Average
-- To be Expanded --
Examples
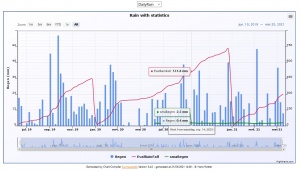
The following example shows the Rain for all days (all observations). In addition the yearly cumulative curve is shown and the moving average (SMA - Simple Moving Average). See image on the right. The period for the Moving Average is given by the user as value to the parameter : PeriodMovingAverage= <value> (section [graphs]
 CHART DailyRain TITLE Rain with statistics
   PLOT ALL RainFall colour CornflowerBlue as column
   PLOT ALL RainFall EVAL [ SUM( RainFall ) ] COLOUR crimson AXIS Free
   STATS RainFall SMA colour green
 EndChart OUTPUT Statistics.txt
