Heat/cold degree days and Chill hours
Explanation
Heat Degree Days
You may have a thermostat that makes your heating come on when the temperature falls below a threshold. Cumulus calculates an integration of the number of degrees below a threshold you select over the time that the temperature is below that threshold.
Cumulus reports this by month as part of the National Oceanic and Atmospheric Administration (NOAA) style report, in the annual NOAA report, in dayfile.txt, and via heating degree days web tag. (NOAA is an Operating Unit of the U.S. Department of Commerce). If the threshold you select in Cumulus matches your thermostat, the reported value gives you a measure for how hard your heating system has worked; otherwise it is a statistic that gives you a feel for how cold it has been.
So if for the whole of November, there was just one hour at one degree below the threshold, two hours at five degrees below, and three hours at seven degrees below; the total for the month would be (1*1)+(2*5) +(3*7) hours reported as 32 degree days.
Chill Hours
A related measure, also reported by Cumulus counting the hours below a (different) configurable temperature threshold for the 12 month period starting on the 1st day of a configurable month, is Chill Hours.
The traditional way of calculating the accumulation of Chill Hours is the number of hours the temperature is below 45F or 7.5C for the period of 1st October to 30th April in the Northern Hemisphere. On Cumulus that threshold, and start date are the default, so you simply observe the reported value on 30 April. The current figure is viewable on the 'This Year' screen accessed from the View menu, and is available via web tag <#chillhours> to be added to a web page template of your design.
The main applicability is to stone and seed fruit as their exposure to low temperatures during the winter months will have a significant effect on the following harvest. Too few cold hours can result in poor quality and quantity of the crop. Fruit tree varieties prefer a Chill Hour rating from below 200 hours to around 1500 hours.
However, the way it can be configured on Cumulus will allow you to track air frost hours, ground frost hours or any other below the threshold parameter.
Sfws 10:53, 1 December 2012 (UTC) (with thanks to Randy who raised Enhancement Request #117 and supplied some of the above text)
Cold Degree Days
You may have a thermostat that makes a cooling system come on when the temperature rises above a threshold.
Cumulus calculates an integration of the number of degrees above the threshold over the time that the temperature is above that threshold.
Cumulus reports this by month as part of the NOAA report, in the annual NOAA report, in dayfile.txt, and via cooling degree days web tag.
So if for one day in June, successive readings at one minute intervals above the threshold were 1, 2, 3, 4, 5, 6, 7, 8, 9, 10, then it stayed 10 degrees above for 1 hour, before falling in successive minutes to 9, 8, 7, 6, 5, 4, 3, 2, and 1 degrees above the threshold, the total for that day (of 1440 minutes) would be 150 degree minutes reported as 150/1440 or 0.1 degree days.
Sfws 10:53, 1 December 2012 (UTC) (with thanks to Mark Crossley for help with understanding degree day unit)
Setting the threshold
Heat and Cold Degree Days for NOAA reports
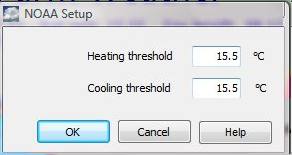
 The thresholds for Heat and Cold Degree days are set in the NOAA Setup option within the Configuration menu. The picture shows just parts of the setup screen. It allows you to specify the two thresholds in the units you have selected to use in your implementation of Cumulus. Cumulus stores your selected threshold values in the cumulus.ini file within the folder containing your Cumulus software (see Cumulus.ini#Section:_NOAA).
CAUTION: Think carefully, about what threshold to use.
If you later change the threshold, only subsequent calculations use the new threshold. All past calculations were based on the old threshold, so values shown on existing NOAA reports for a month or a year with a threshold change will be rubbish (the new threshold is shown on the report, but it has not been applied retrospectively), and need to be manually recalculated making any consequent edits directly on past reports.
The View menu in Cumulus allows you to generate new NOAA reports for a month (or year). The new report will use the latest thresholds, and there is an option to save the new report (overwriting any previous one if you use the same name).
Configuring Chill Hours
The Chill Hours defaults are configurable by adding entries to the [Station] section in Cumulus.ini:
ChillHourSeasonStart=10
ChillHourThreshold=45
The season start figure is the calendar month number (1 to 12), and the temperature threshold is specified in the units that you use in Cumulus.